Report 1 World
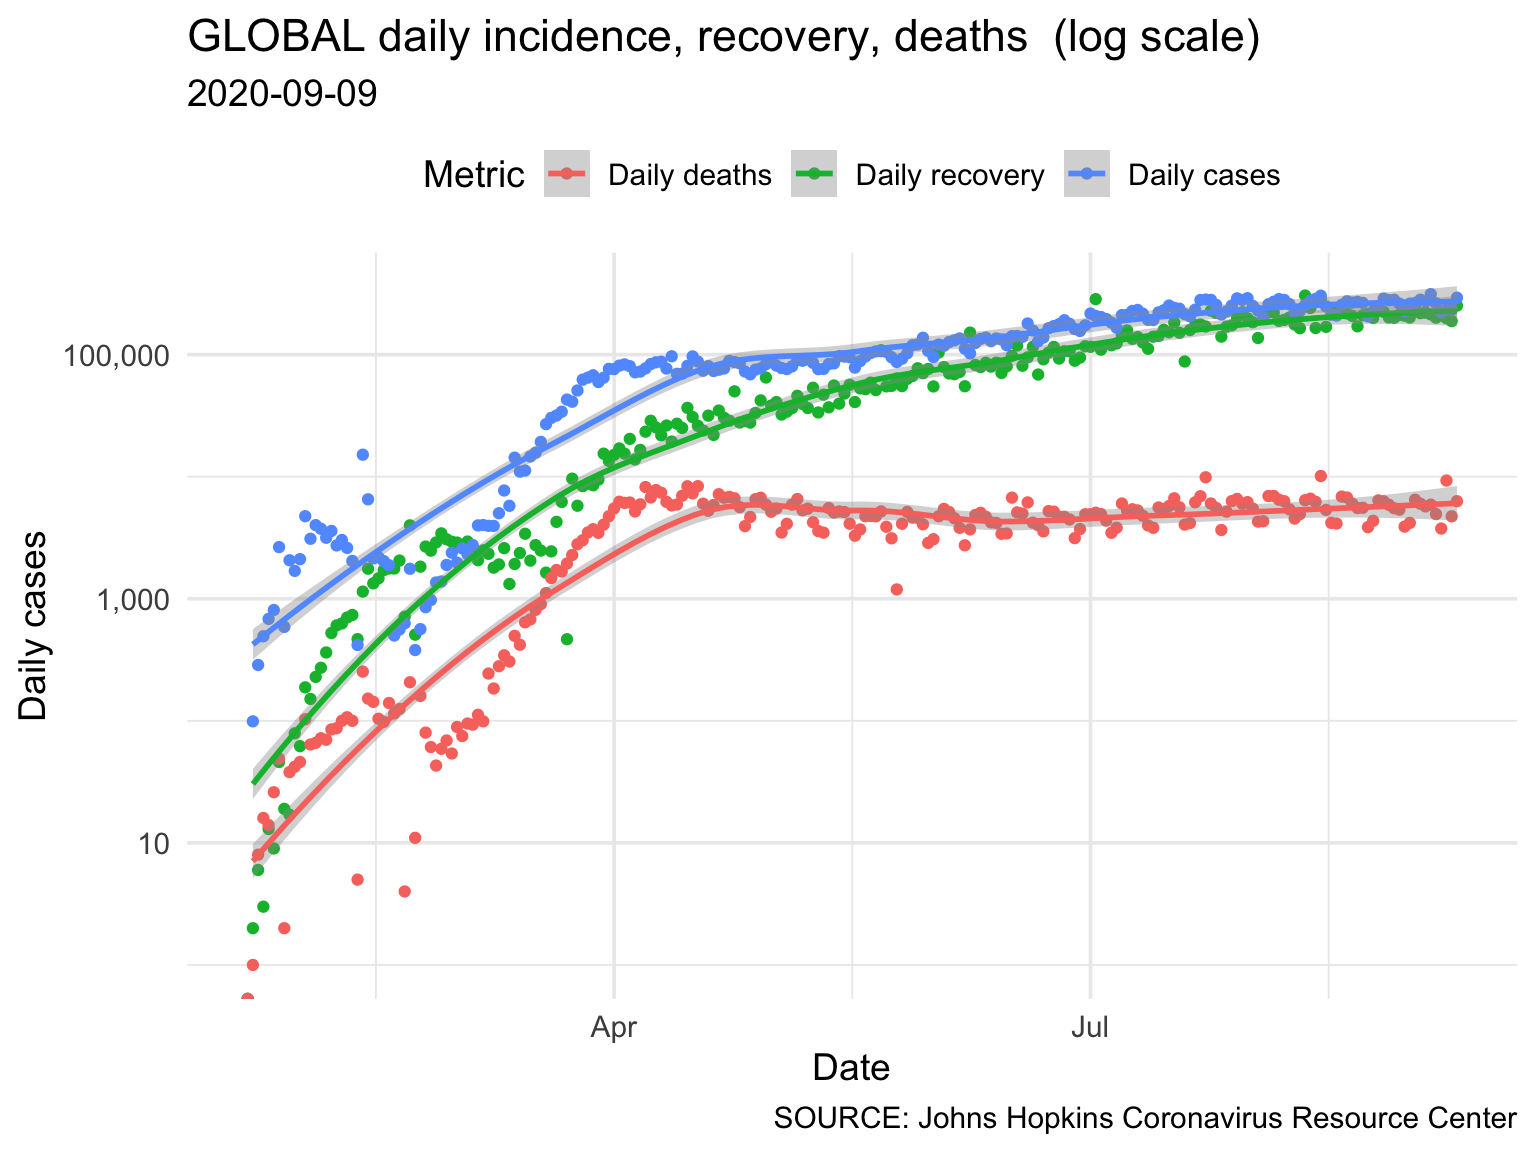
1.1 Daily Incidence, Recovery, Deaths
Report last updated: 2020-09-10
Data last refreshed: : 2020-09-09
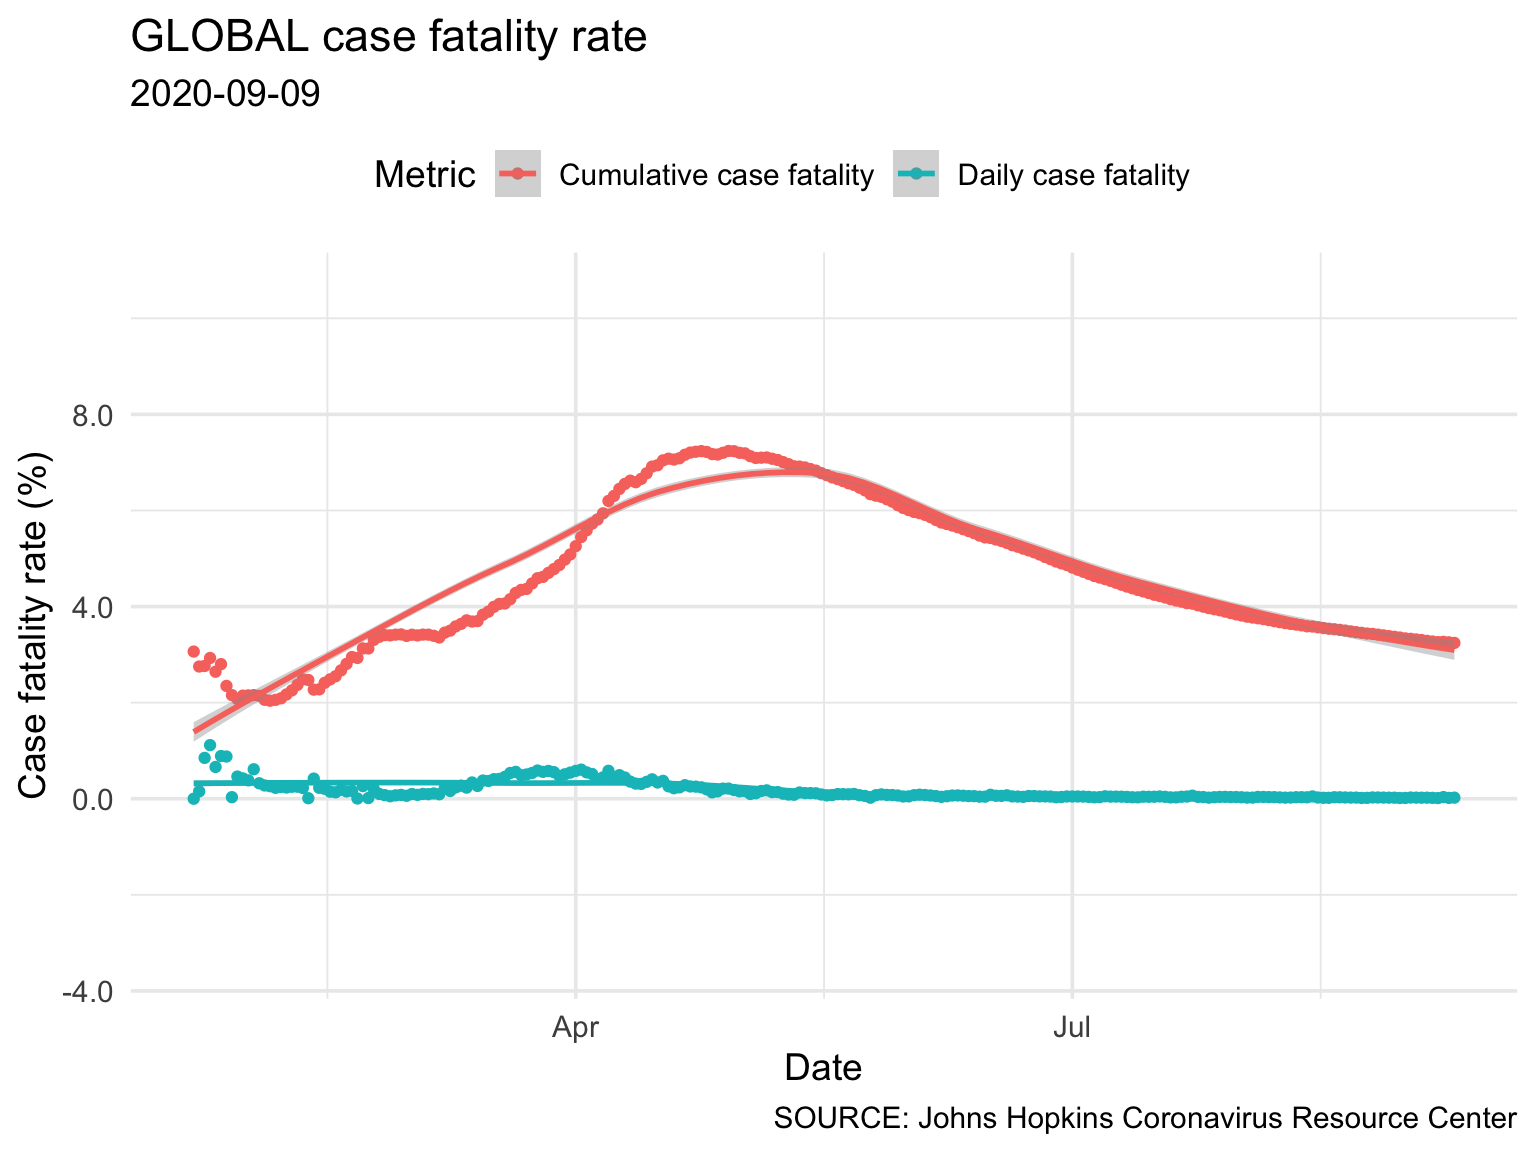
1.2 Case Fatality Rate
Case fatality rate is calculated by dividing the number of deaths from a specified disease over a defined period of time by the number of individuals diagnosed with the disease during that time; the resulting ratio is then multiplied by 100 to yield a percentage (Harrington 2020).
\[CFR = \frac{\# Deaths}{\#Infected} \times 100 \,\, per \,\,unit \,\, time\]
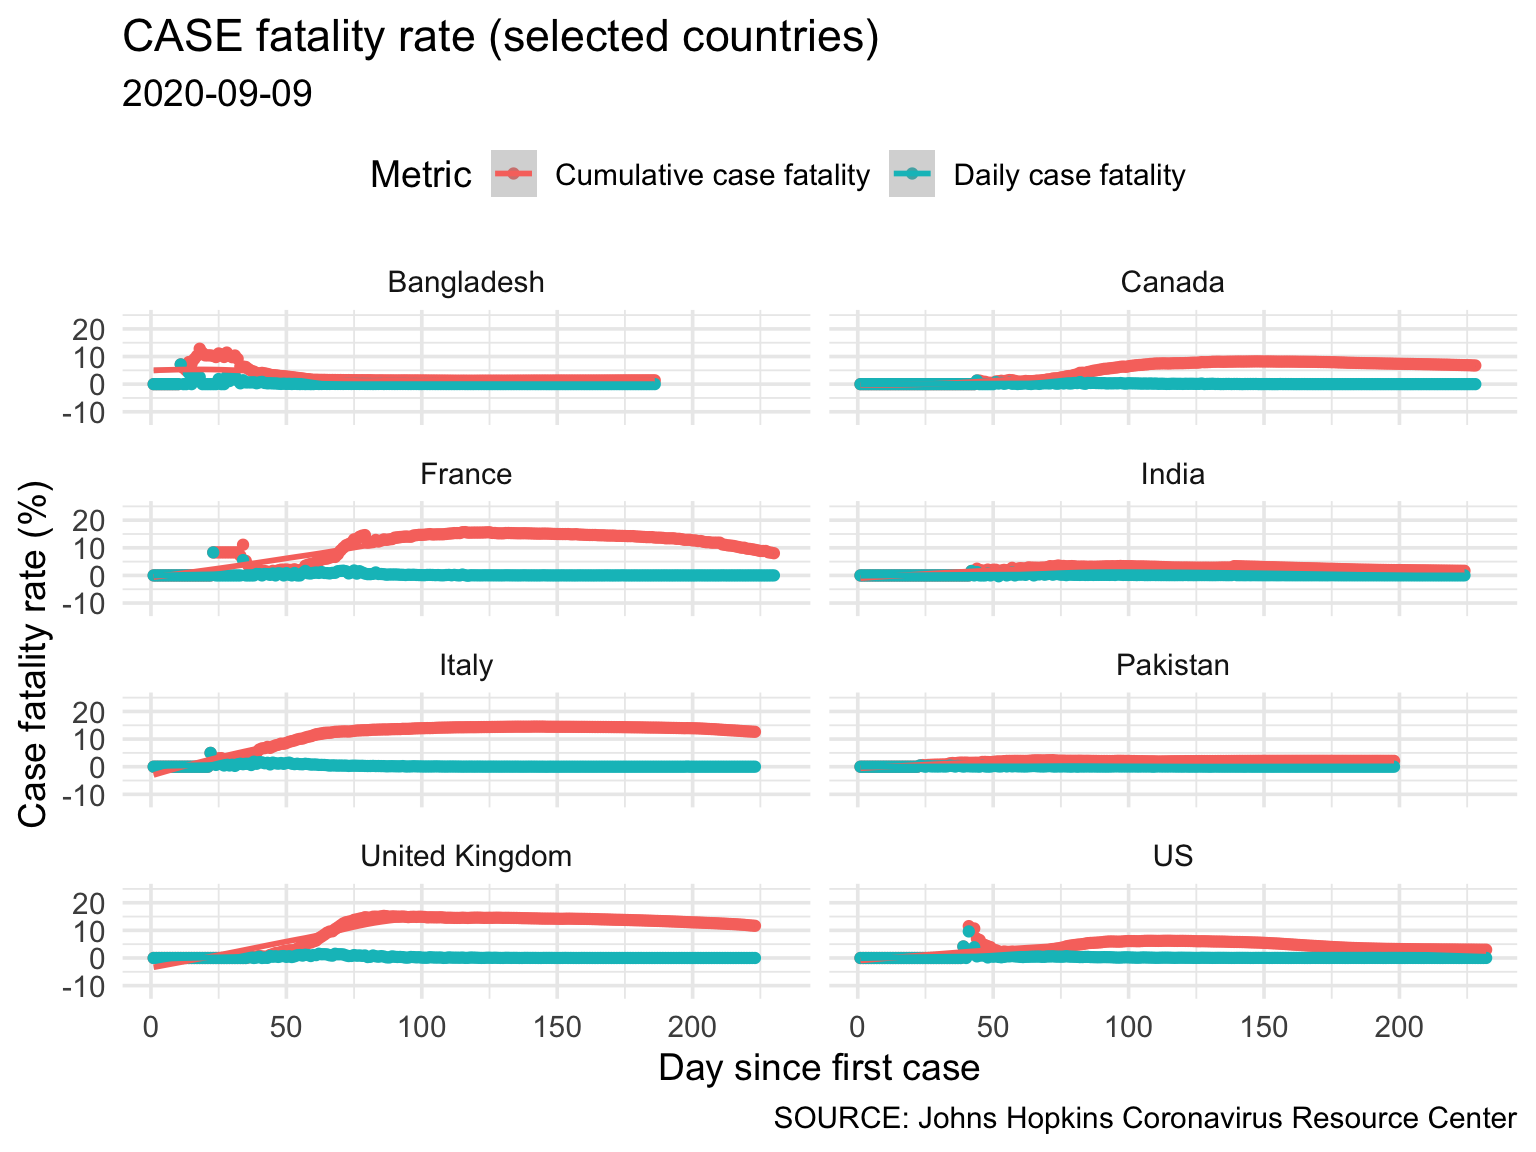
1.2.1 Case Fatality Rate (select countries)
1.3 Confirmed Cases
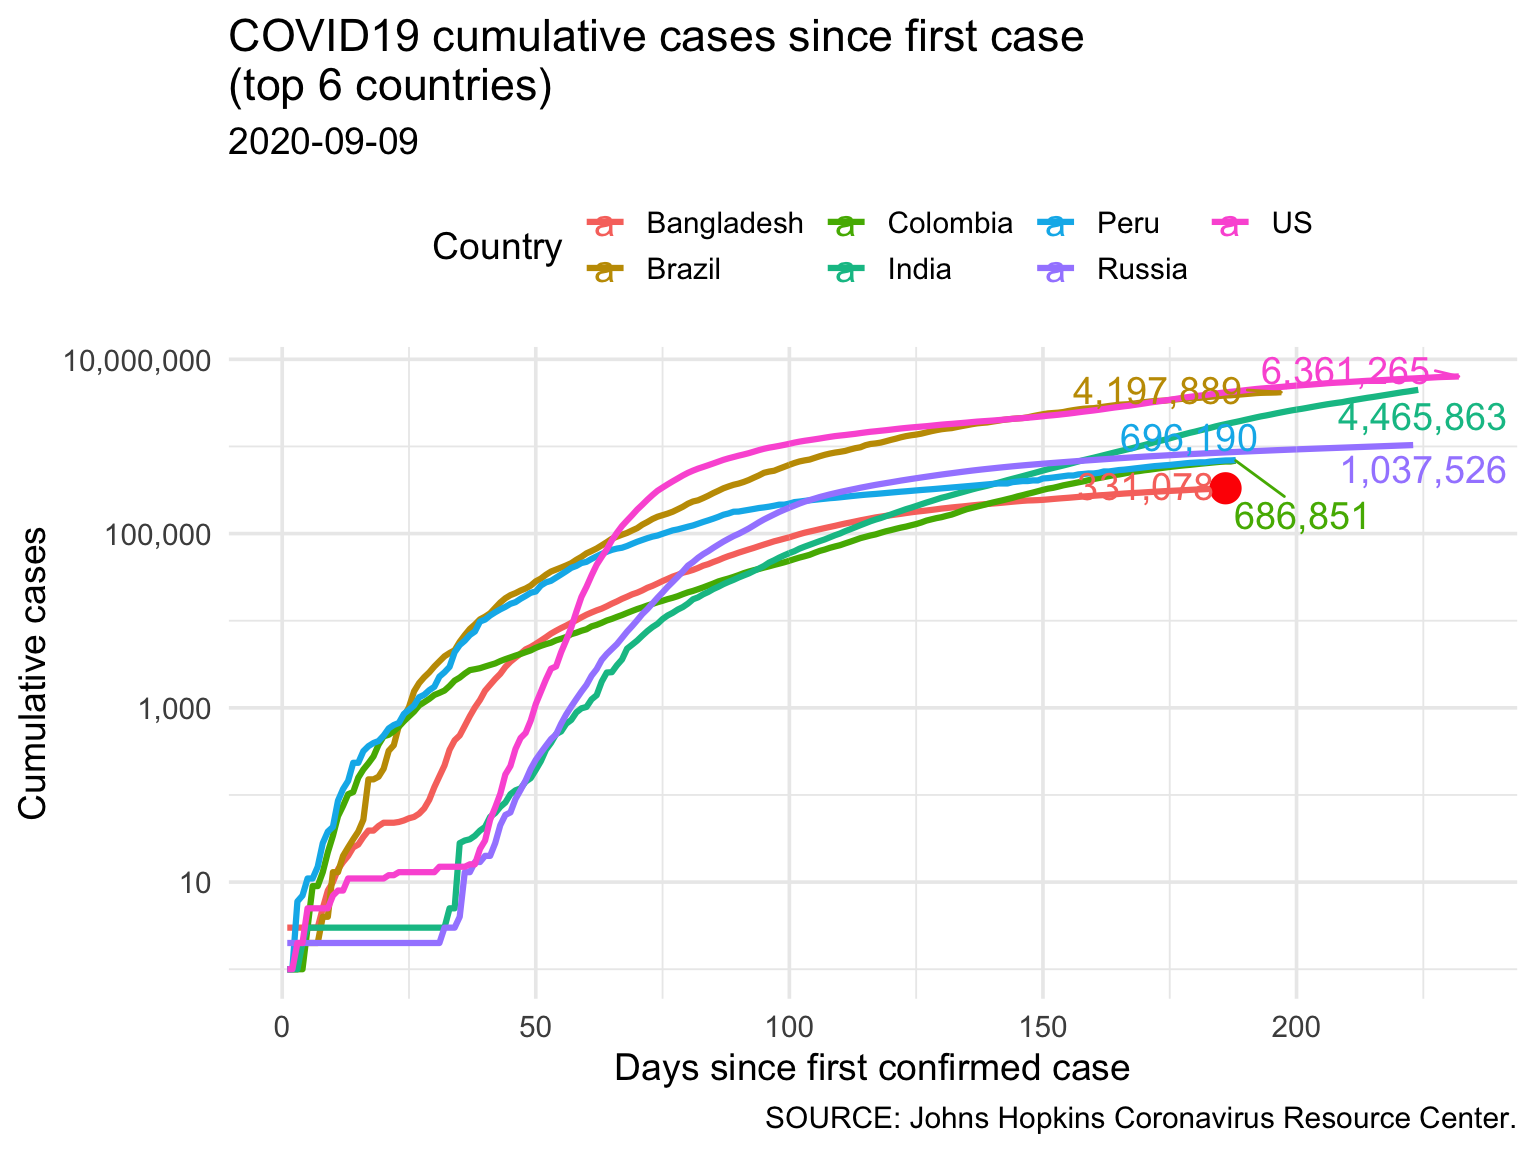
| country | Confirmed |
|---|---|
| US | 6361265 |
| India | 4465863 |
| Brazil | 4197889 |
| Russia | 1037526 |
| Peru | 696190 |
| Colombia | 686851 |
| Mexico | 647321 |
| South Africa | 642431 |
| Spain | 543379 |
| Argentina | 512293 |
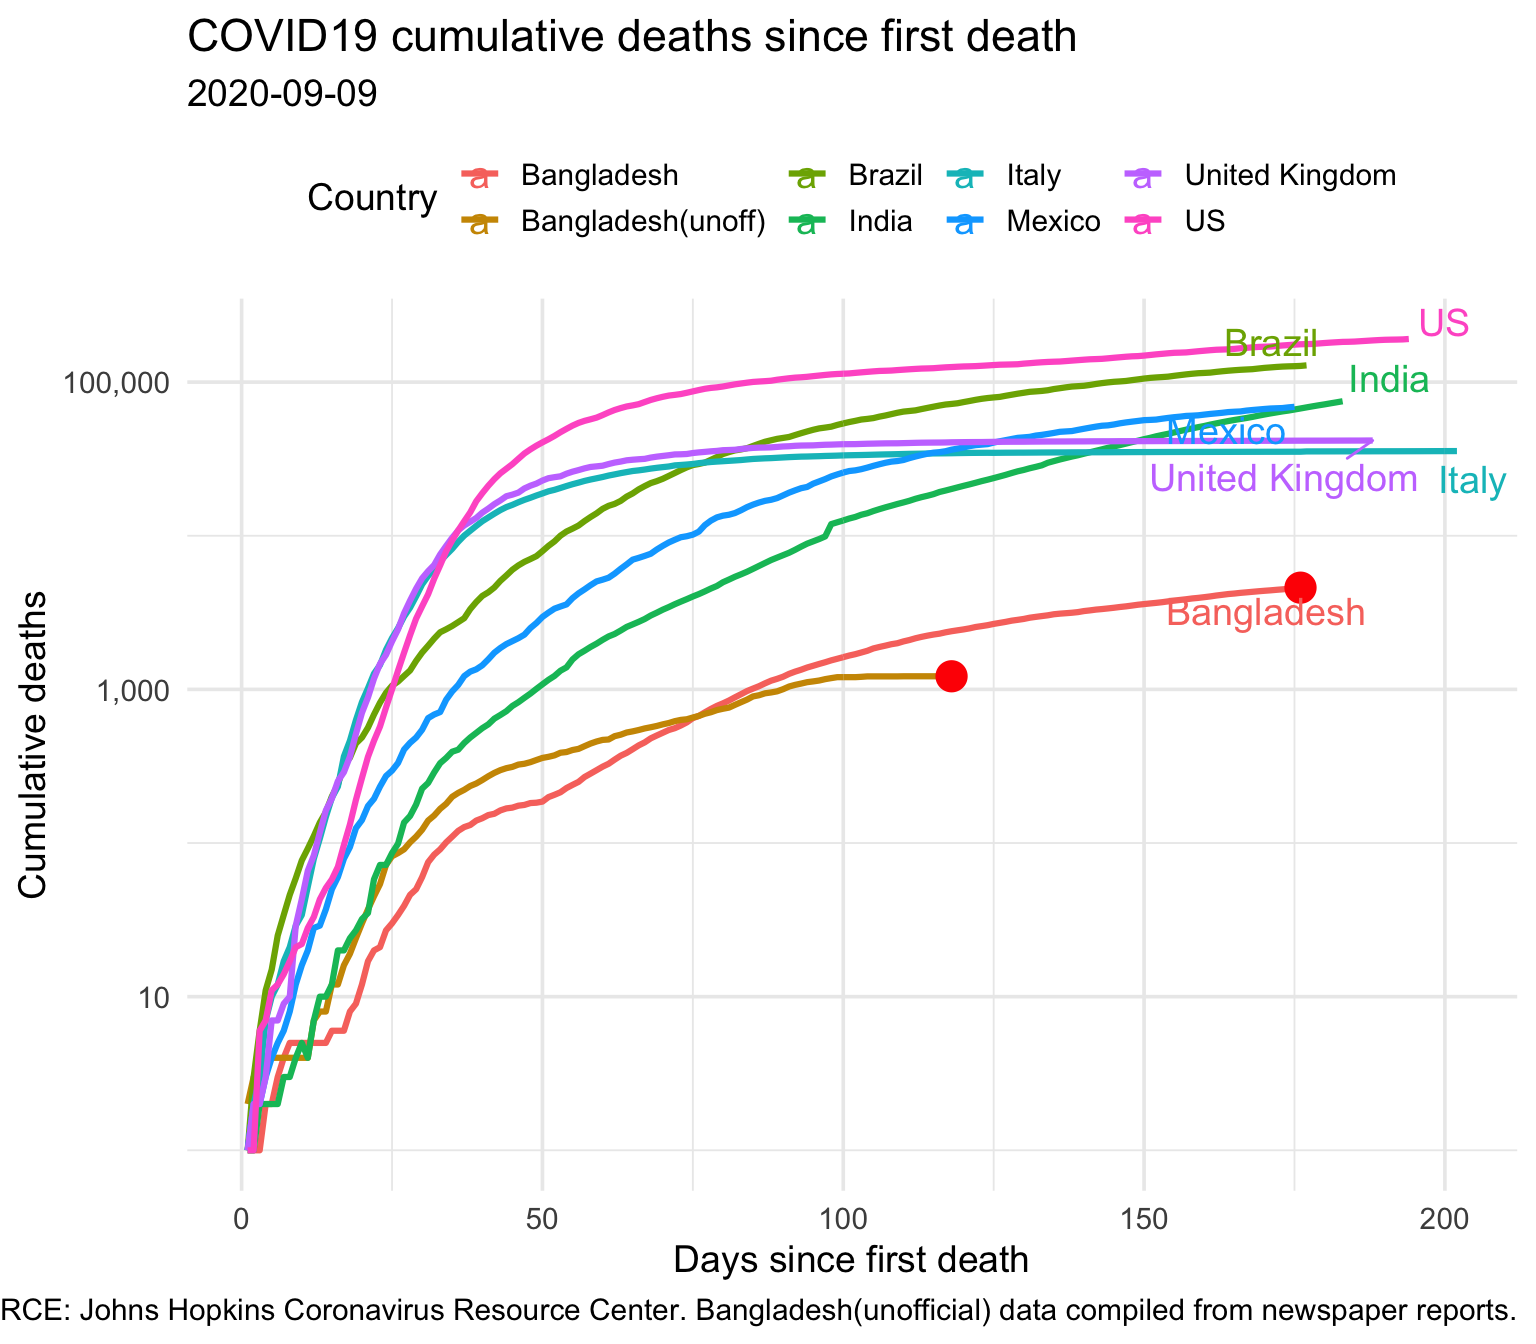
1.4 Deaths since first death
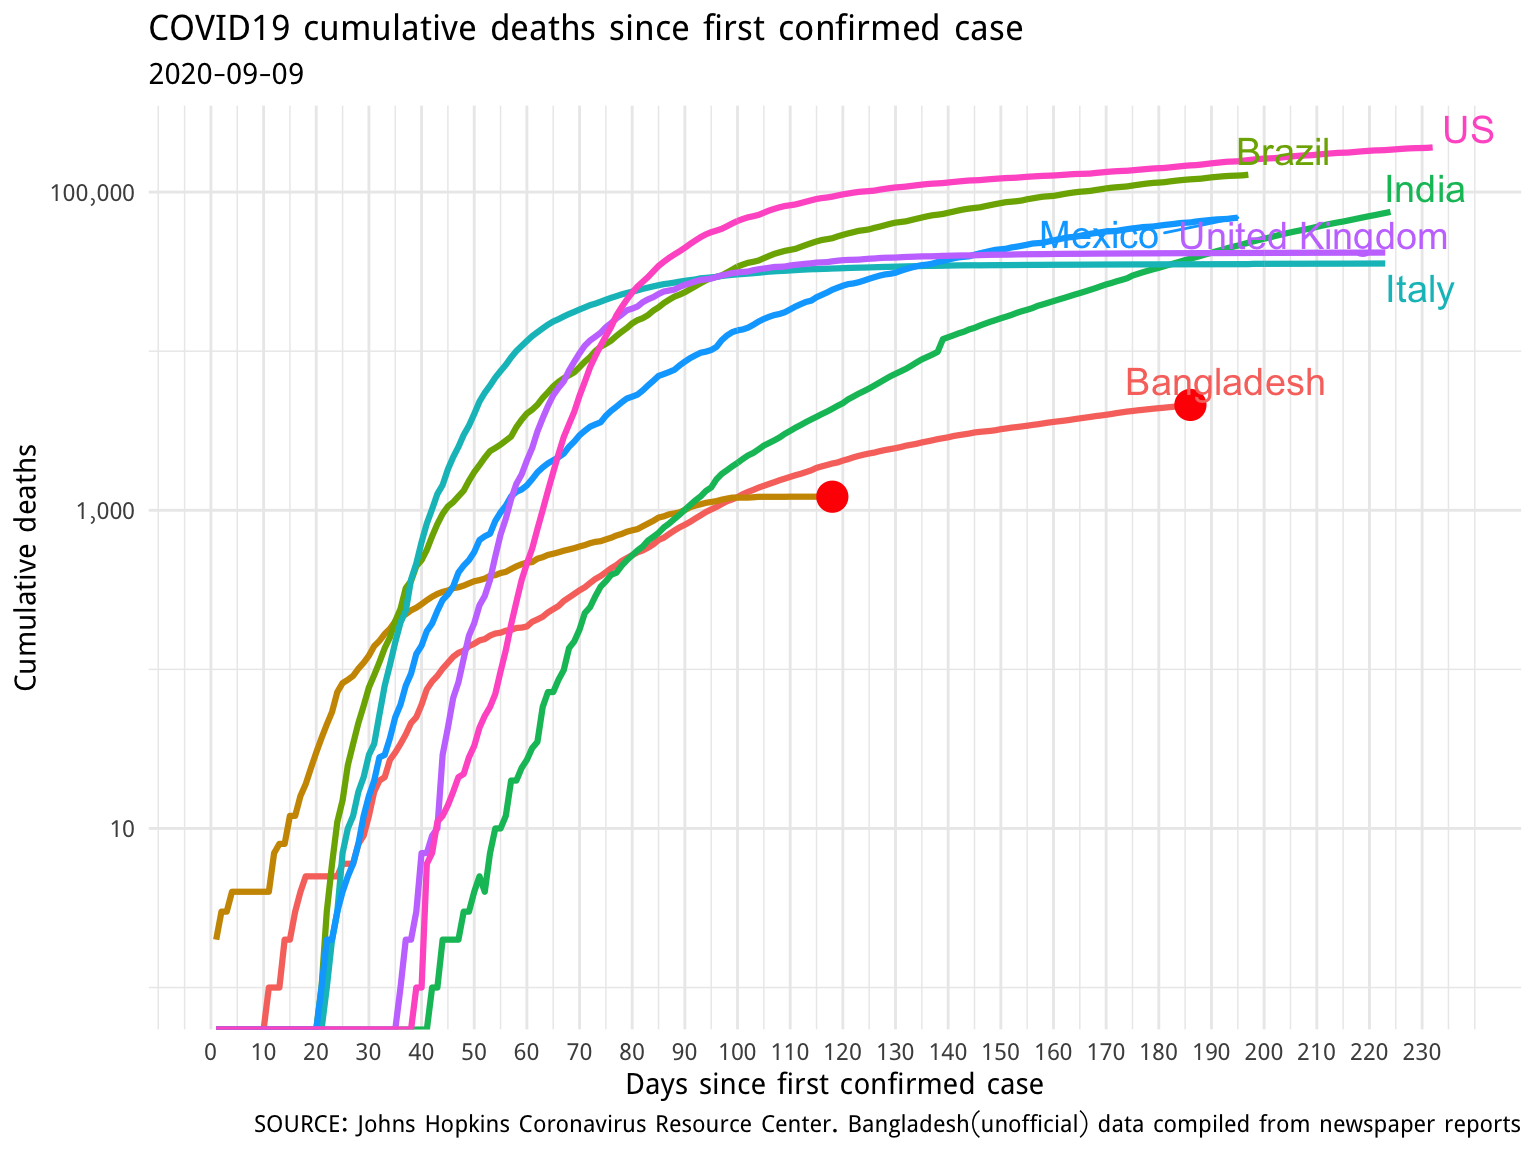
1.5 Deaths since first confirmed case
| country | Confirmed |
|---|---|
| US | 190859 |
| Brazil | 128539 |
| India | 75062 |
| Mexico | 69049 |
| United Kingdom | 41683 |
| Italy | 35577 |
| France | 30805 |
| Peru | 30123 |
| Spain | 29628 |
| Iran | 22669 |
| Bangladesh(unoff) | 1217 |
1.5.1 Cases and deaths compared on a specific day
Bangladesh has entered into day 186 since first confirmed case.
| Country | Total cases | Total deaths |
|---|---|---|
| US | 4178970 | 147184 |
| Brazil | 3846153 | 120262 |
| Mexico | 599560 | 64414 |
| United Kingdom | 307251 | 41293 |
| India | 1803695 | 38135 |
| Italy | 248229 | 35166 |
| Bangladesh | 331078 | 4593 |
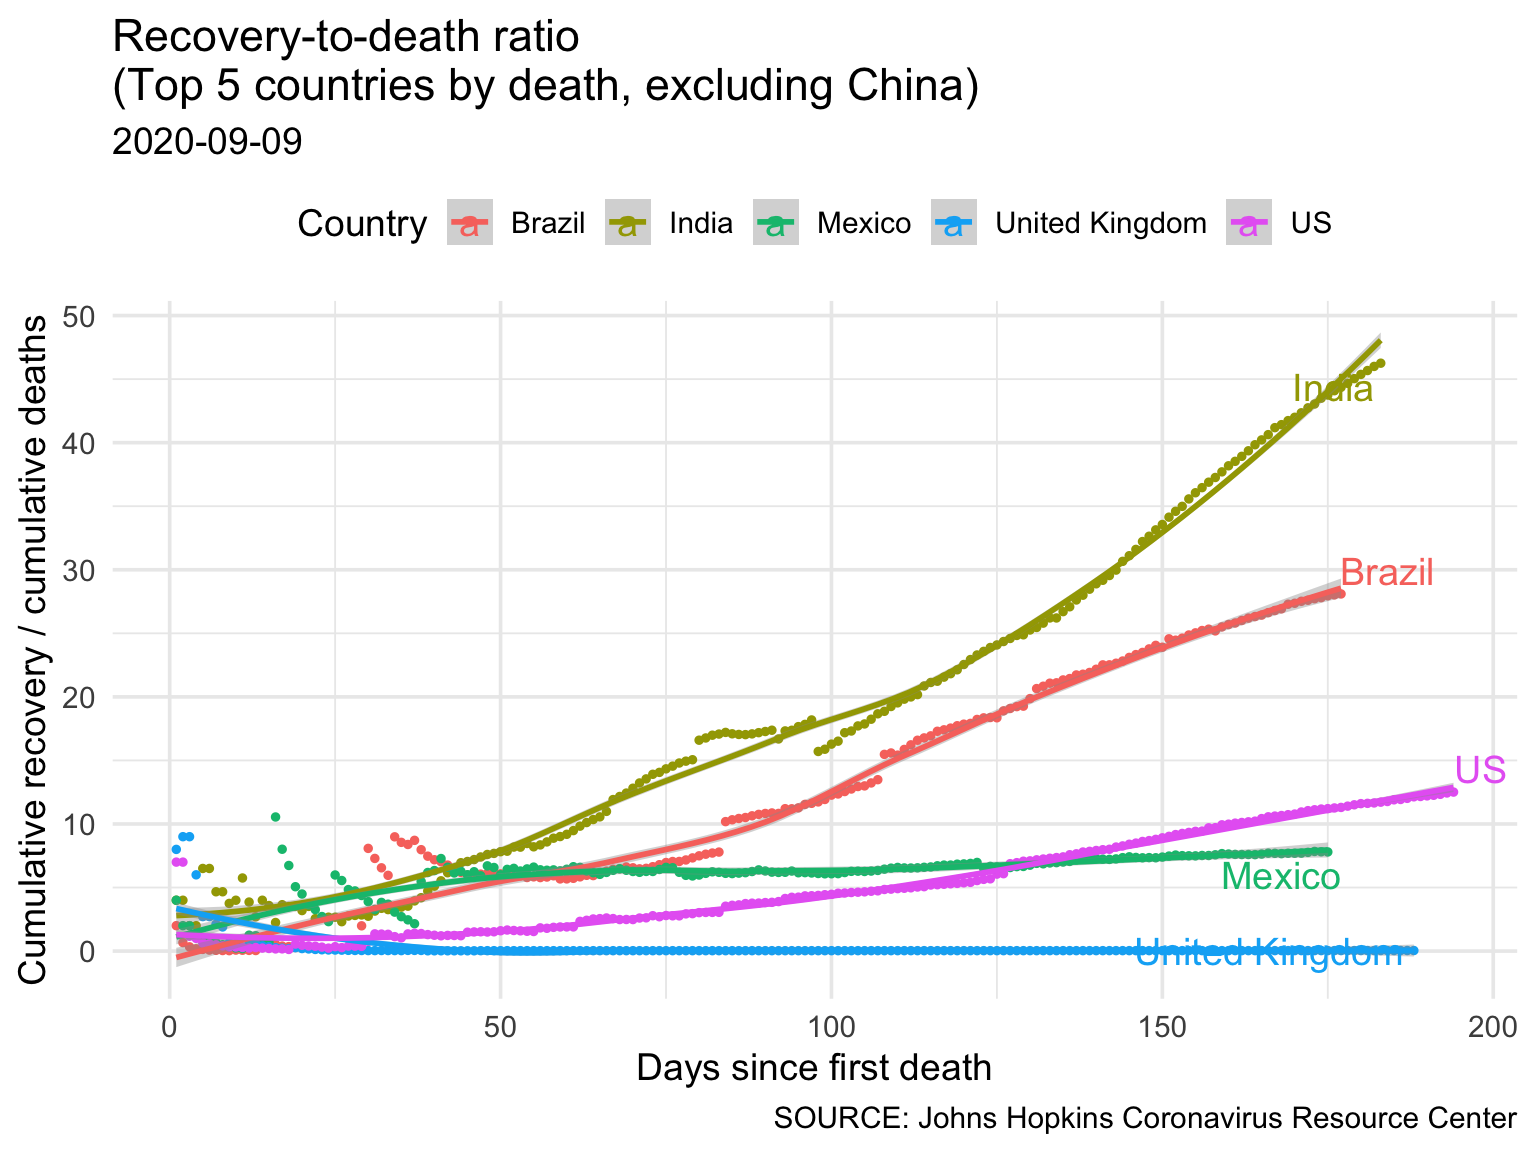
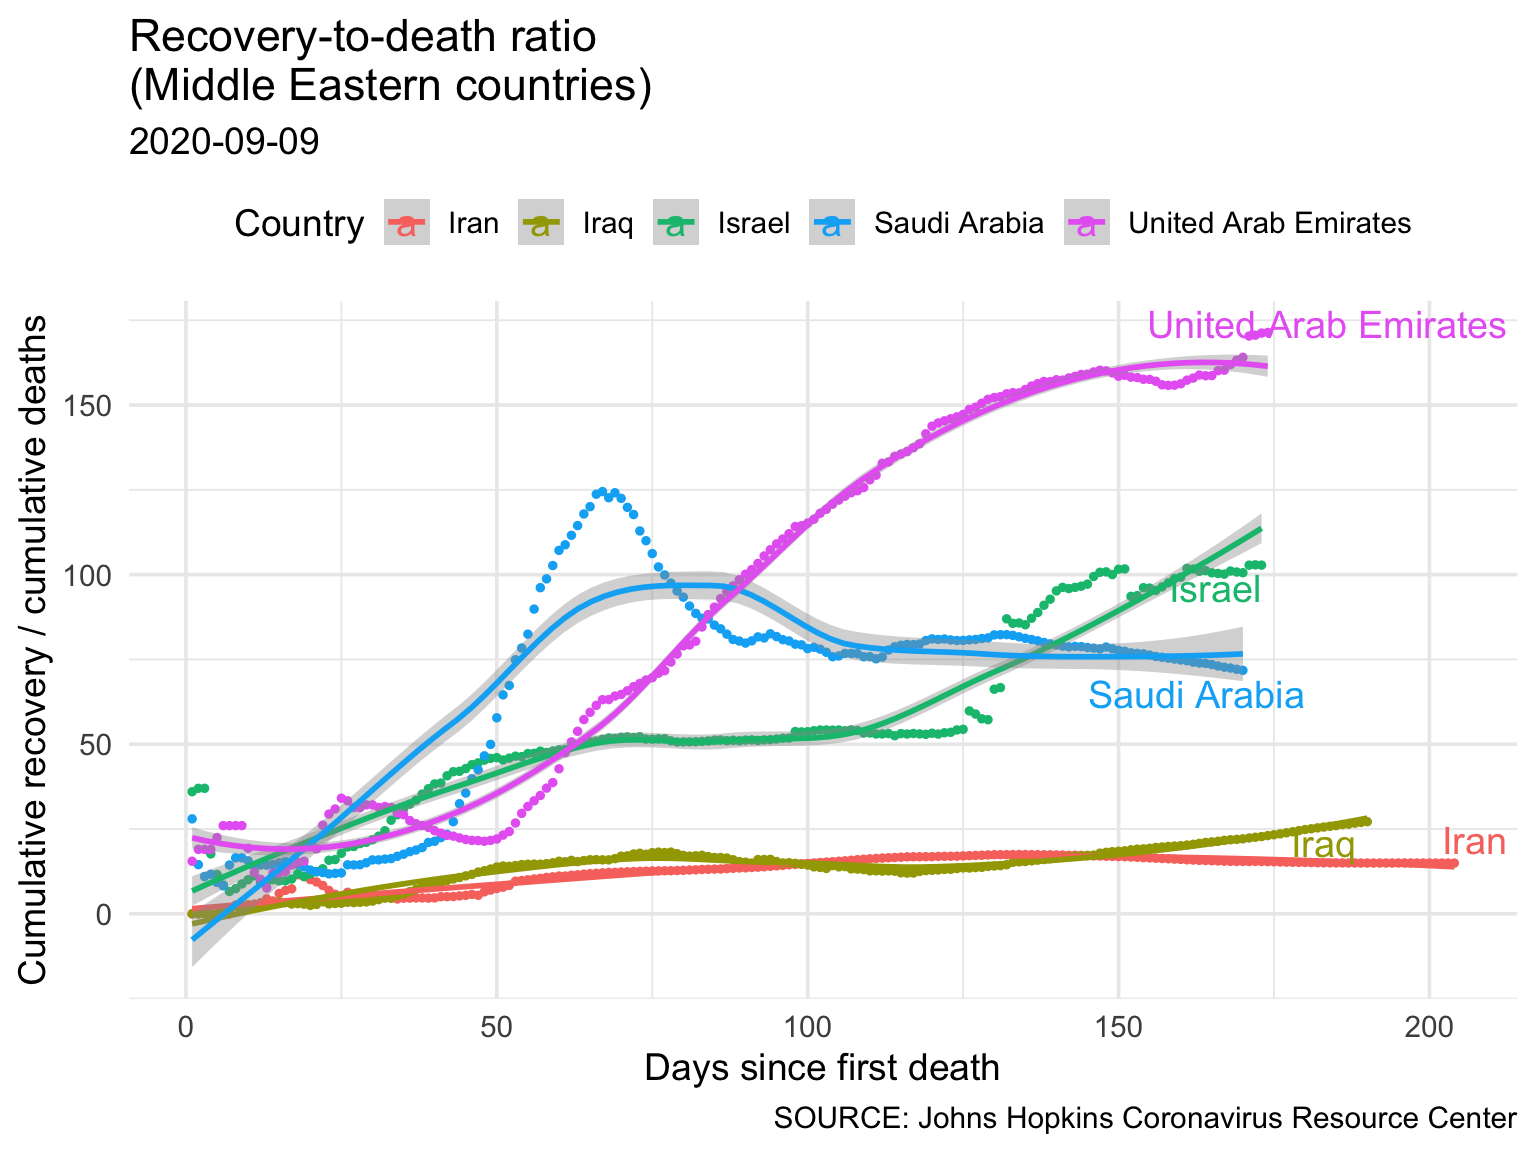
1.6 Recovery-to-death ratio
The recovery to deaths ratio (RDR) is calculated as
\[ RDR = \frac{\# Cumulative \,\, daily \,\, recovered}{\# Cumulative \,\, daily \,\, deaths} \]
How to interpret: The ratio of cumulative number of patients recovered divided by the cumulative number of deaths over time can tell the proportion of people recovering compared to dying. An upward trend may indicate more recovery than deaths.
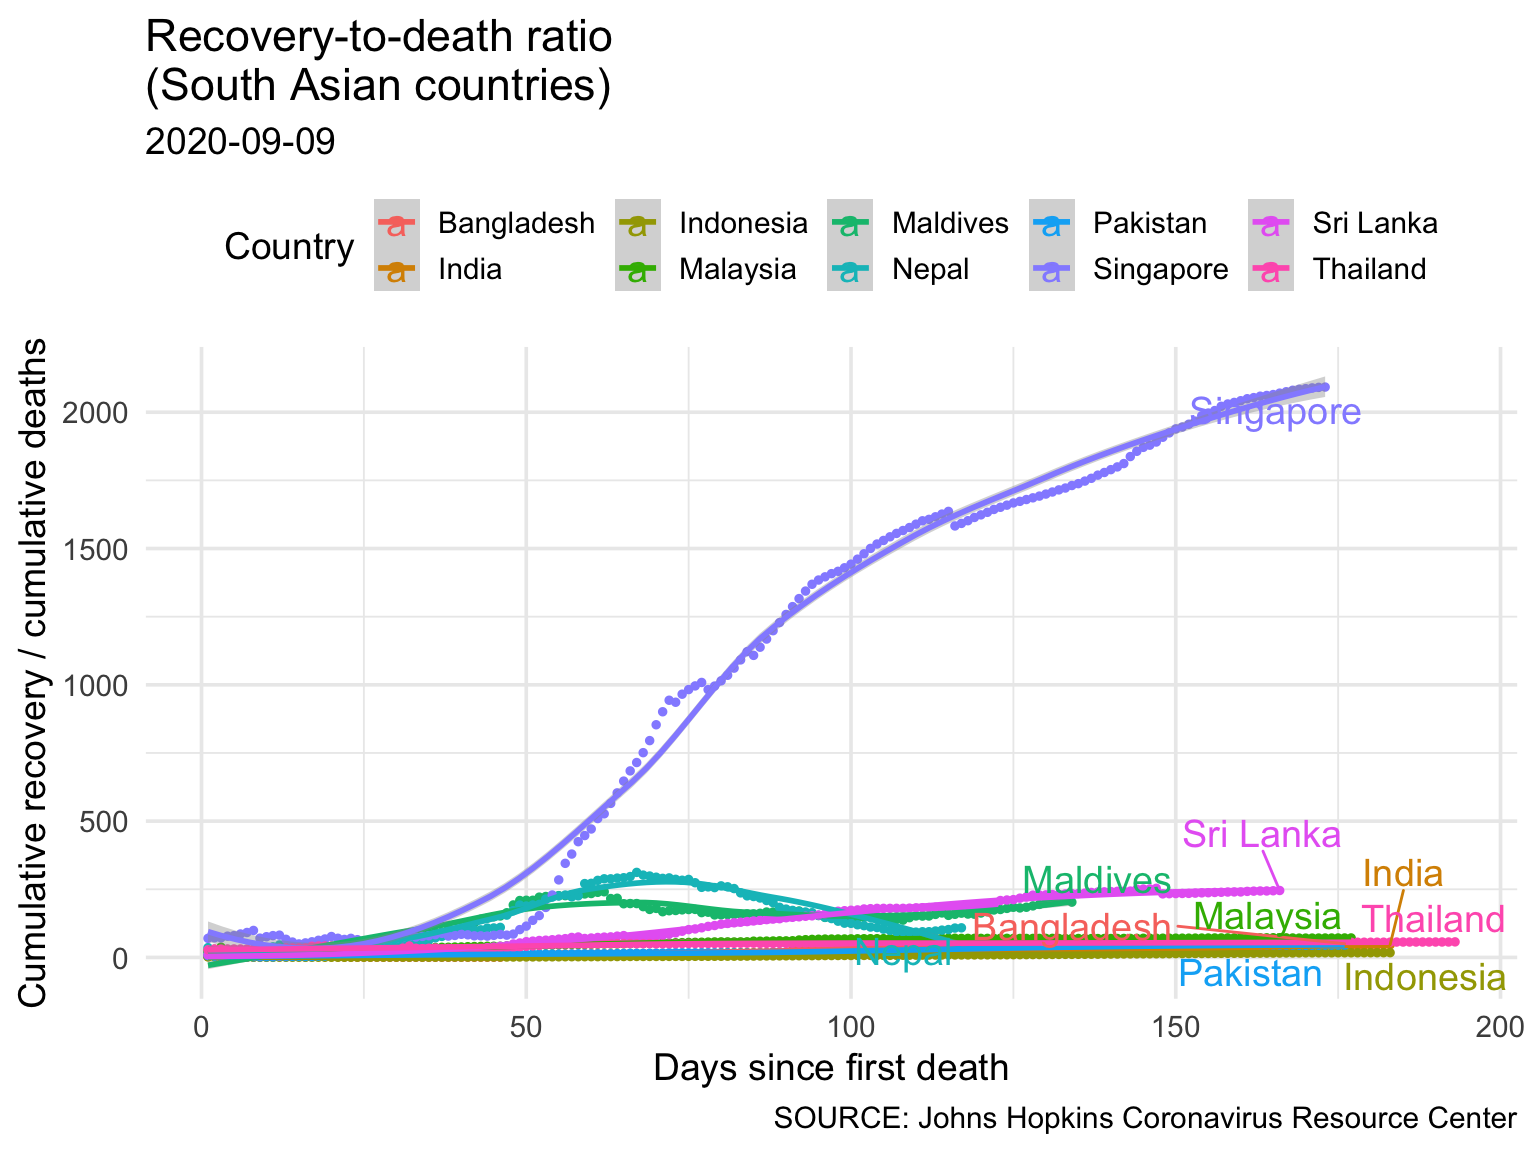
1.6.1 Recovery-to-death ratio (South and South-East Asia)
1.6.2 Recovery-to-death ratio (Middle East)
1.7 3-day % changes
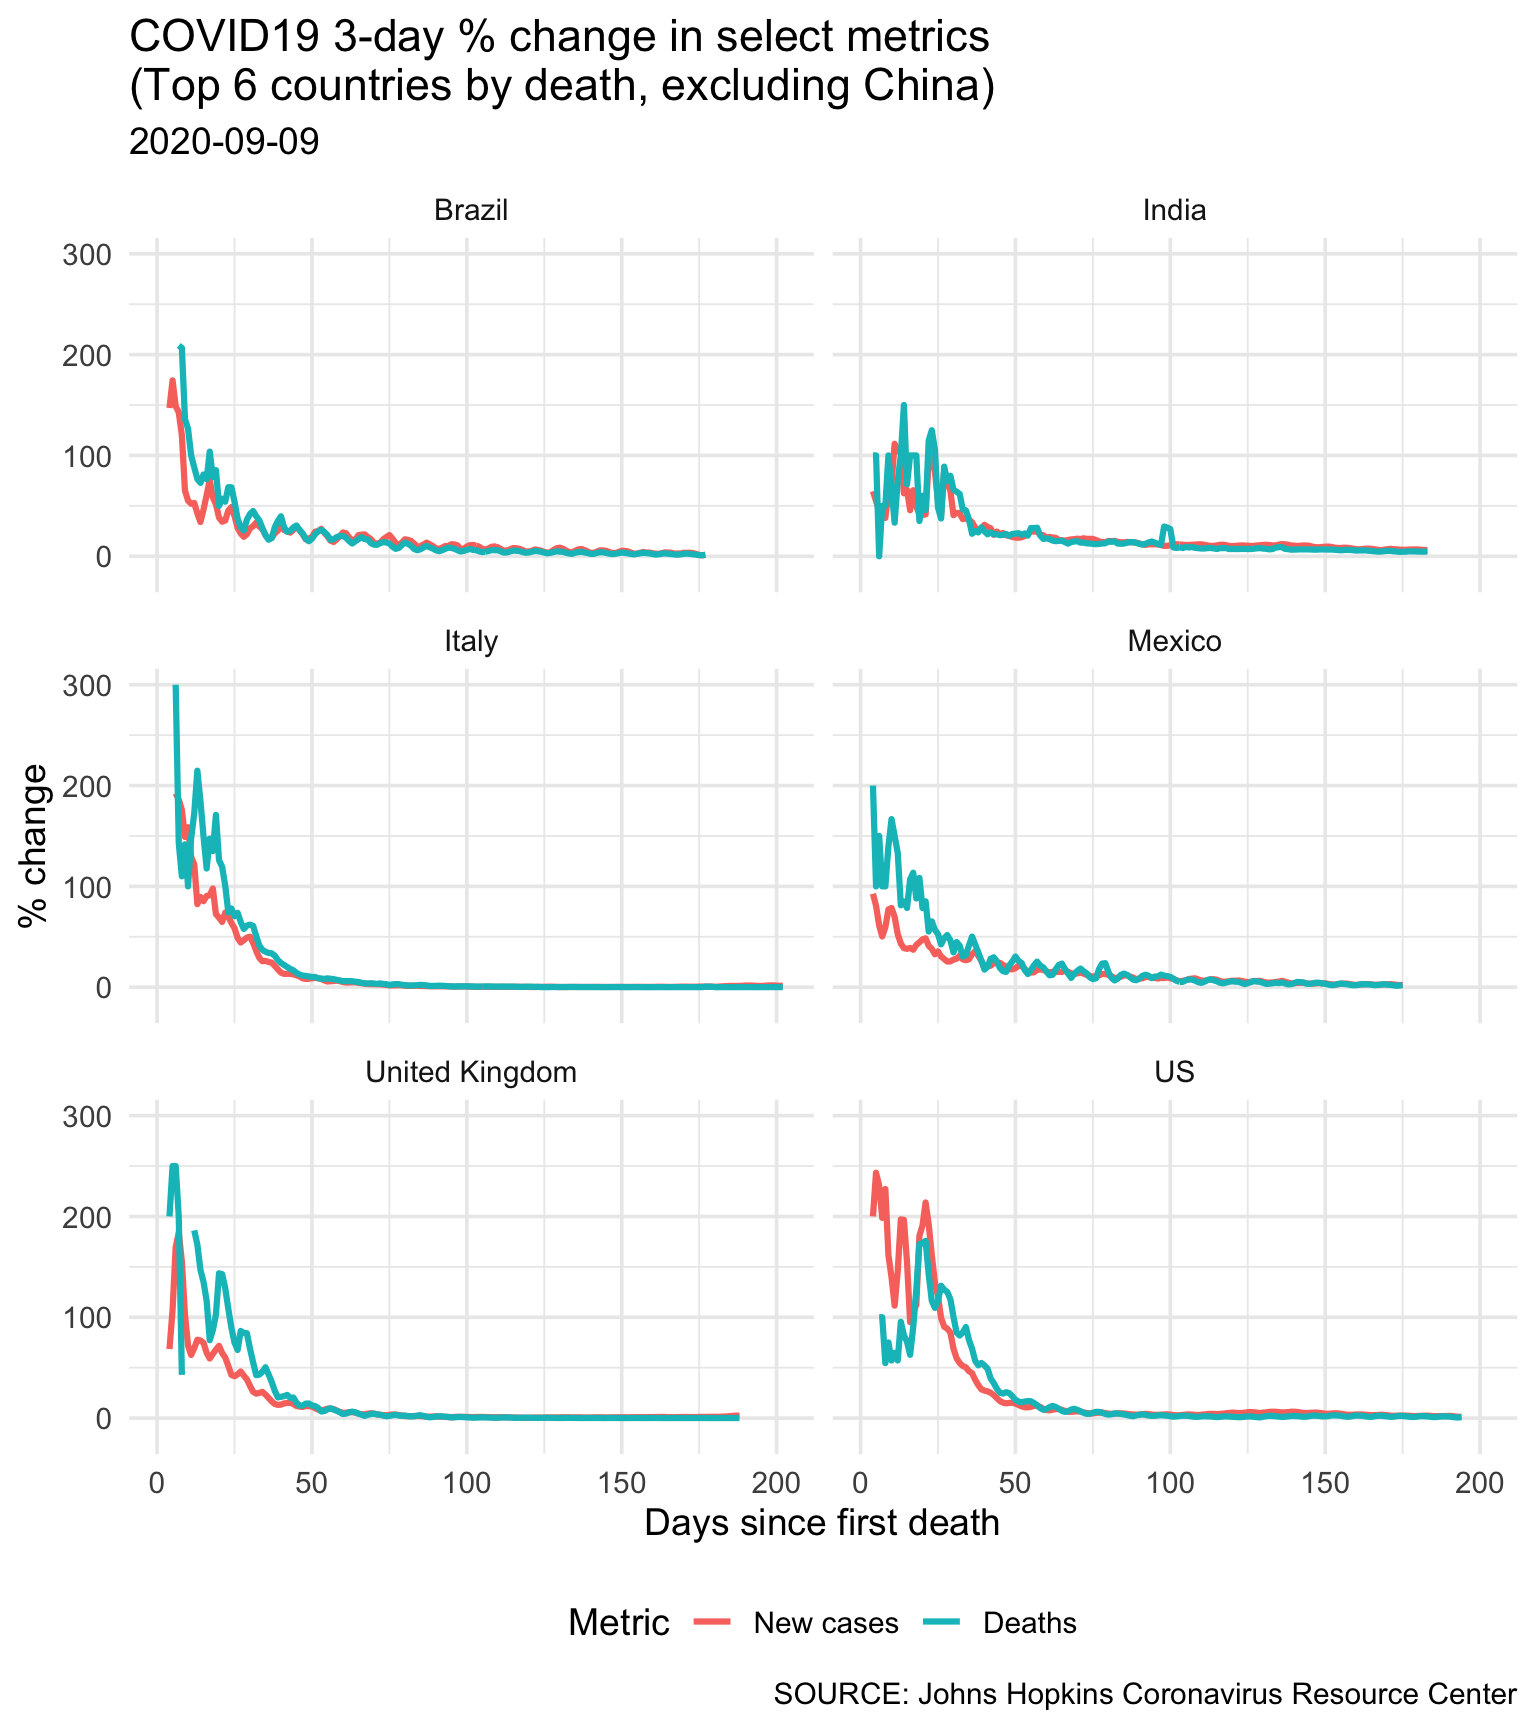
The percent change is calculated as
\[
PC = \frac{New - Original}{Original} * 100
\] where New is the number of cases on a given date, and Original is the number 3 days prior to that.
How to interpret: The 3-day percent change tells how much does a metric have changed (%) compared to what it was 3-days ago. A downward trending line suggests a slow growth.
References
Harrington, Rebecca A. 2020. “Case Fatality Rate.” Encyclopædia Britannica: Encyclopædia Britannica, inc. March 27. https://www.britannica.com/science/case-fatality-rate.